
You’ve seen it a million times before. When a new Playstation hits the market or Apple upgrades the iPhone to the umpteenth version, there is an initial frenzy of zealots clamoring to get their hands on anything and everything new. After them comes an eager but less zealous group that calmly but promptly signs up to get the latest product on launch day. Then you have others who may wait a few months to let the frenzy die down before getting on board.
The product adoption curve represents these different groups of people regarding how apt they are to use new innovative products. In this article, we’ll help you understand the characteristic that defines each group of the product adoption curve and how you can improve adoption within each group.
Which stage of the product adoption curve are your customers at?
No matter the stage, Stonly enables you to provide value to your customers in the right place at the right time.
Start a FREE Trial
What is the product adoption curve?
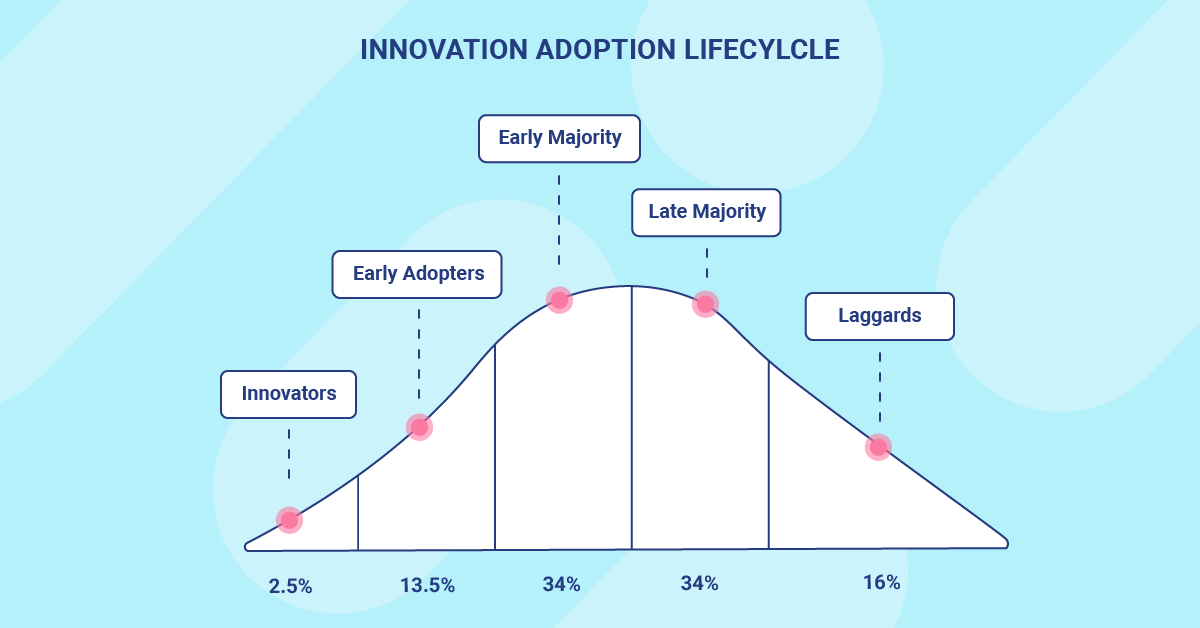
The product adoption curve is a visual model representing the adoption of a new product or innovation over time across distinct adopter groups. It also is commonly referred to as the technology adoption lifecycle and the innovation adoption lifecycle.
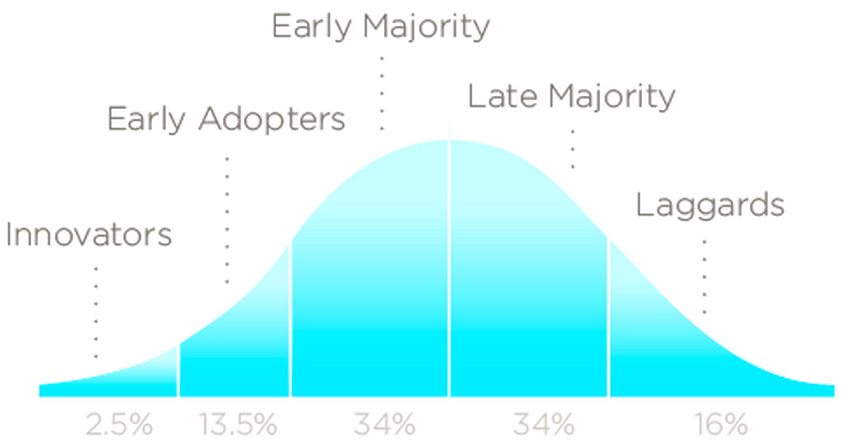
The word “curve” references the statistical concept of a normally distributed bell curve. The X-axis is time, and the Y-axis is the number of people at a given time. The top of the “bell” indicates the average time it takes someone to adopt a new product. The upward curve on the left represents the people that adopt a product in less time than average, and the downward curve on the right represents the people that adopt a product in more time than average.
The word “adoption” refers to the moment when users of a product decide to implement the product into their process. For software product adoption, this typically comes after a free trial or an initial purchase when the user has evaluated the product and decided that it’s valuable enough to continue using and paying for.
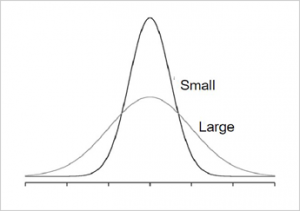
The average time it takes, and the spread of the curve depends on the product and its particular customers. Some products, such as technology for government processes, have a wider, more spread-out adoption cycle. Whereas social media products geared toward young consumers, such as Tik Tok, have a much tighter, more explosive adoption cycle.
Where did the product adoption curve come from?
The product adoption cycle has its roots in research about agricultural innovation published at Iowa State University in 1957 under the title “The diffusion process”.
The researchers were originally investigating the purchasing behavior of innovative hybrid seed corn by farmers. But they stumbled upon the phenomenon repeated across many other innovative products that show distinct consumer adoption behavior categories.
5 Categories of the Product Adoption Curve
The curve is divided into five distinct adopter groups with similar demographic and behavioral characteristics. Keep in mind that while people may tend to behave similarly across many different products, each product curve is unique, and the people in each category are grouped by how they adopt a specific product.
1. Innovators – 2.5%
Innovators are an exceptional group of initial “first adopters” of a new product. This is the smallest of all the adopter categories, willing to try your product without substantial evidence that it even works.
In terms of the characteristics that describe users in this category, innovators:
- Personally enjoy discovering new things and telling others that they were the first.
- Feel the pain your product solves so strongly that they have little to lose by trying it.
- Are very technically savvy and don’t mind wading through bugs or issues.
- Are very comfortable with taking risks.
2. Early Adopters – 13.5%
Early adopters are the next group of users who adopt a product very early, but without much enthusiasm (or recklessness) as the innovators. If you can picture the line of customers waiting for a store’s doors to open before a mega-sale event, the innovators are the ones sprinting through the doors while the early adopters employ more of a brisk stroll.
In terms of the characteristics that describe users in this category, early adopters:
- Are willing to try products early, but want to see at least a couple of others try them first.
- Feel the pain that your product solves strongly.
- Are technically savvy and know how to troubleshoot their way through buggy products.
- For the most part, are comfortable with taking risks when the reward is promising.
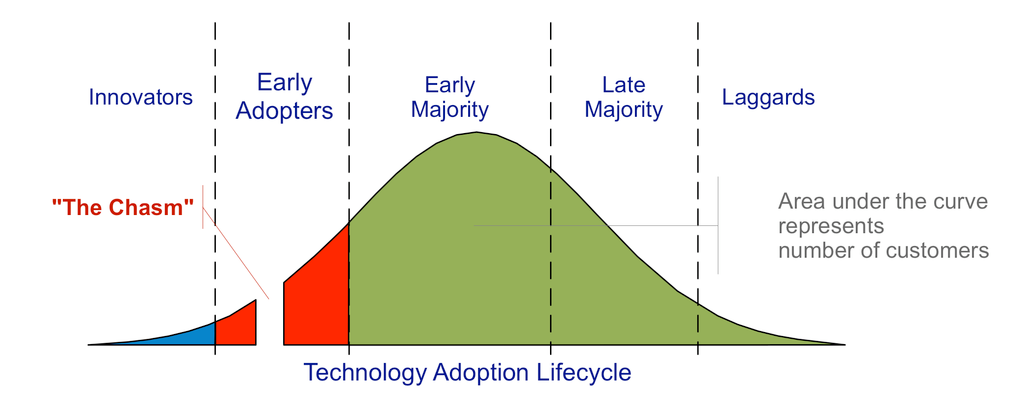
The “Chasm”
Geoffrey Moore further popularized the product adoption curve, emphasizing a gap between the early adopter and the early majority categories. The chasm represents a stage where little to no adoption happens until the product iterates and evolves to meet the expectations of the early majority, which are more demanding than the initial two categories.
Because of the popularity of Moore’s work, the chasm is often automatically associated with the product adoption curve.
3. Early Majority – 34%
The early majority differs quite a bit from the innovators and early adopters, commonly referred to as the visionaries. People in this category are more pragmatic when adopting new products. As its name implies, they represent the earlier portion of the larger majority on either side of the average time for adoption.
Regarding the characteristics that describe users in this category, those in the early majority:
- Are open to trying new products, as long the solution has initial evidence that it works.
- Feel the pain your product solves, but care most about finding a practical solution.
- Are technically savvy but are less tolerant of wasting energy on buggy products.
- Are willing to take some risks, but usually avoid them if possible.
4. Late Majority – 34%
The late majority are similar to the early majority, and the two together make up over two-thirds of your overall product adopters. People in this category are hesitant to change and will only adopt your product when they feel they have to, often fearing being at a disadvantage by waiting any longer.
In terms of the characteristics that describe users in this category, those in the late majority:
- Are hesitant to try new products and require significant vetting by peers before adopting.
- Feel the pain your product solves but are okay living with it for a time.
- Have little tolerance for software that isn’t fully functional with little lag time.
- Are generally risk-averse and put forth a lot of effort to avoid it.
5. Laggards – 16%
The laggards are the skeptical, “last users” who’ve held out as long as possible, almost as a source of pride. These users may often go out of their way to avoid adopting a product that clearly works, and the majority of users are happy with.
In terms of the characteristics that describe users in this category, laggards:
- Avoid trying new products and require some coercion to adopt a new product.
- Feel the pain your product solves but are willing to live with it or solve it another way.
- Often are not technically savvy and need guidance to use a product effectively.
- Avoid taking risks and will go to great lengths to avoid them.
How can you improve SaaS product adoption within each category of the product adoption curve?
Knowing about the product adoption curve and its categories is one thing, but learning how to use that knowledge and increase adoption within each category will set your product apart and enable faster growth.
1. Innovators
Innovators want to be the first, so leverage that desire and make a splash to attract this category of adopters before you launch a new product.
How to position and message your product:
- Emphasize that no one has seen or used the product yet and that access is exclusive.
- Play to their desire to be first and that adopting early will give them bragging rights.
Product features to focus on:
- Build a pre-adoption queue, and allow users to join and know their place in the line.
- Effect a pre-launch by invitation only to enable innovators to feel exclusive.

2. Early Adopters
People in this stage are actively looking for smart, better solutions to the pains that they are experiencing. The best thing you can do is hyper-focus on one specific pain that your product solves the best for one type of customer.
How to position and message about your product:
- Keep your messaging focused on a single pain that your product solves.
- Play on still being the best-kept secret with early evidence of explosive growth.
Product features to focus on:
- Focus on your single most important feature, and release updates frequently.
- Give an incentive to share the product, such as discounts or a free upgrade.
Crossing The “Chasm”
The chasm, which separates the visionaries from the pragmatists, is a difficult hurdle for many companies to cross, especially for B2B and enterprise SaaS adoption.
How to position and message about your product:
- Keep your messaging focused on a single pain for a single market.
- Use all possible evidence of momentum and growth to get you across the chasm.
Product features to focus on:
- Get your single most important feature operating bug-free at scale.
- Give extra attention to performance, unprofessional UI, and security.
3. Early Majority
Getting the early majority on board is proof that you’ve crossed the chasm, have proven product-market fit, and are on your way to winning a sizable chunk of market share. This group expects a complete, practical solution to their problems.
How to position and message your product:
- Showcase your product as innovative, but immensely practical and an obvious fit for your target market.
- Leverage notable early adopters frequently to show your product works the way you say it does.
Product features to focus on:
- Focus on adding a few new features that are hyper-relevant to make your product more complete for your main target market.
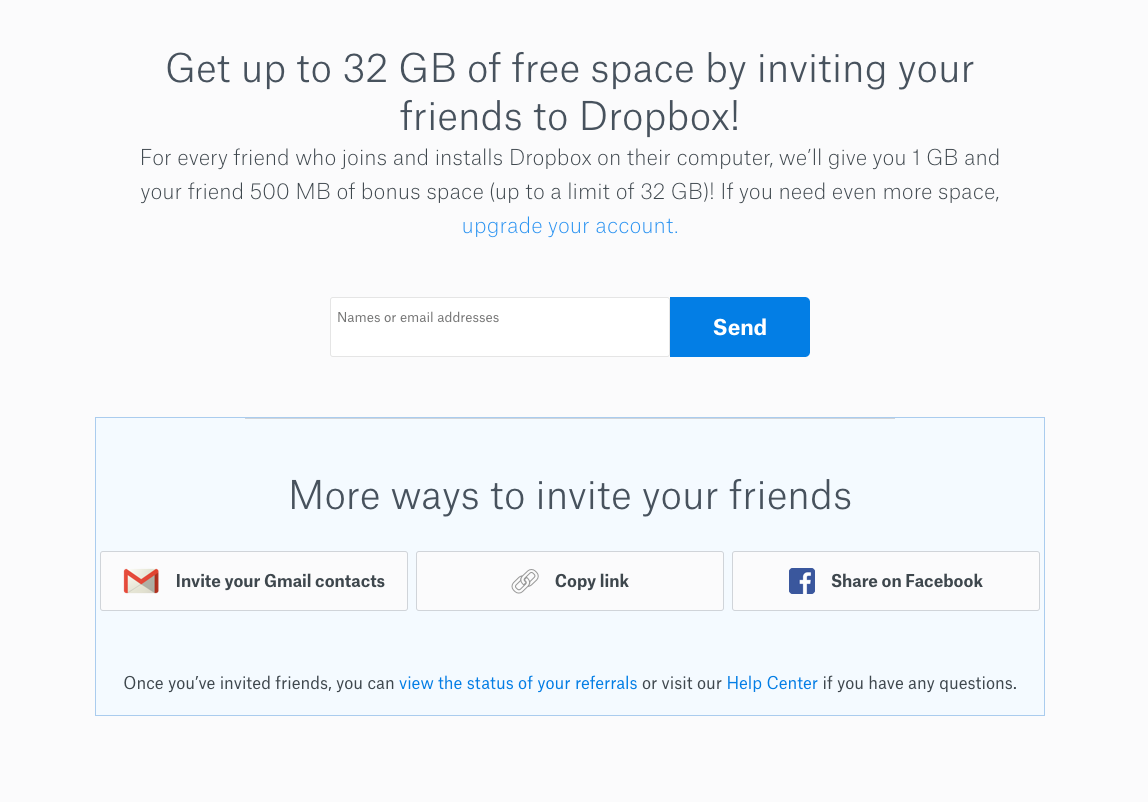
- Implement SaaS onboarding best practices to showcase to new users clearly and practically how they can get value from using your product to solve their problems.
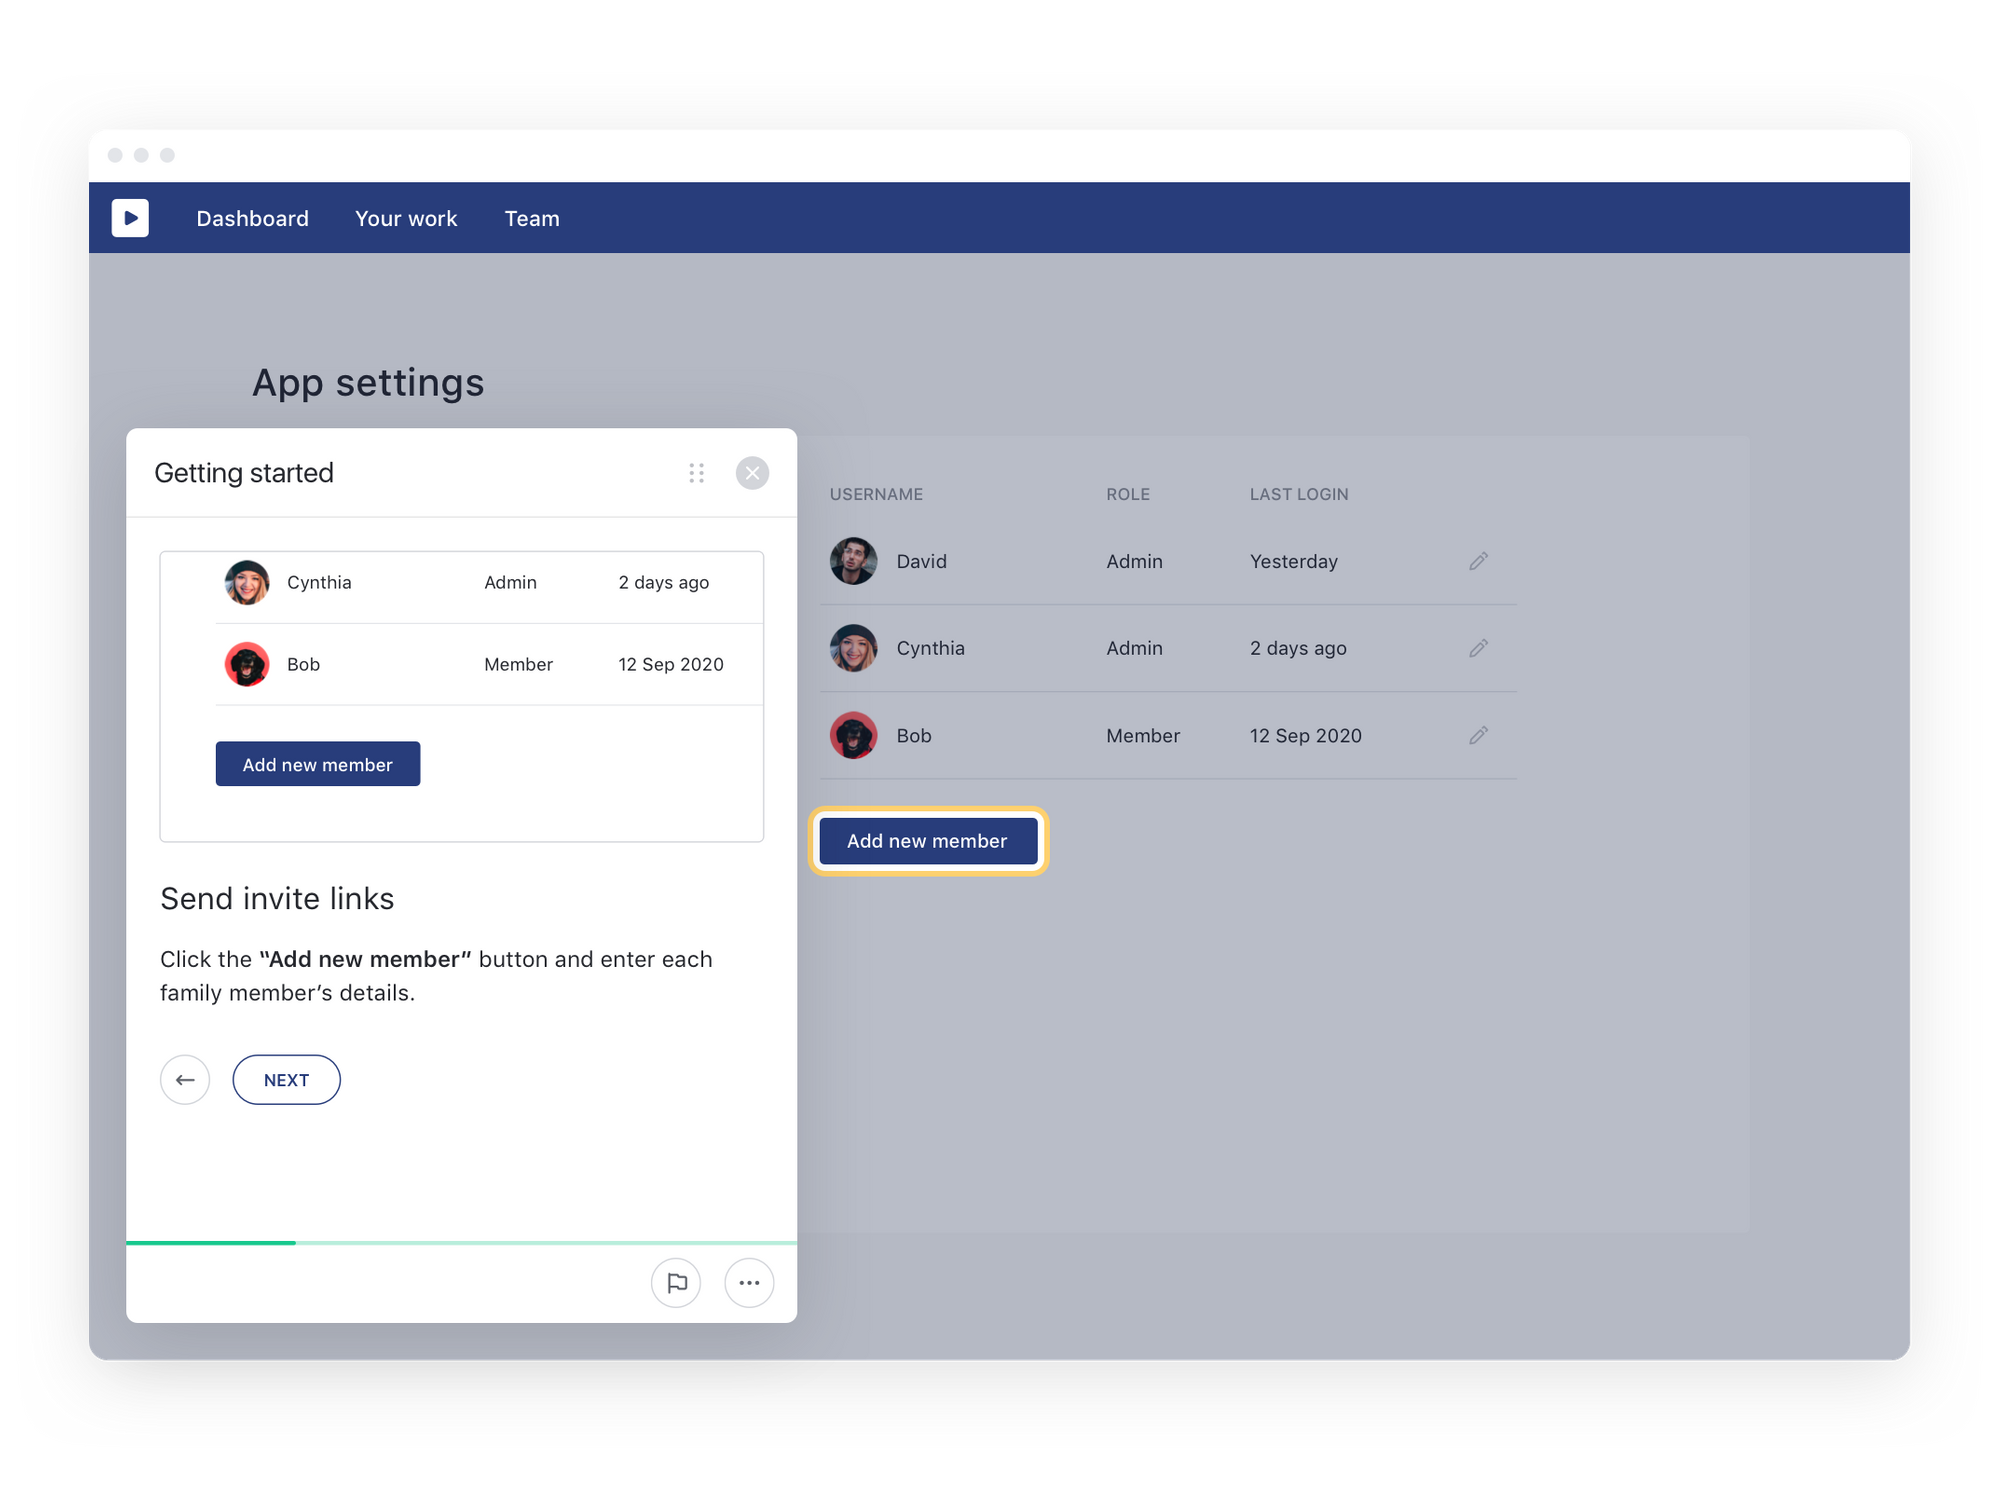
Stonly is your best user onboarding tool to create an interactive onboarding experience that drives customer activation and adoption. Instead of implementing a one-size-fits-all product tour that feels like busywork, Stonly helps you build practical, informative guides that let customers choose which product areas to explore that are more relevant to their version of success.
4. Late Majority
The late majority group of adopters drives a hard bargain. They already know that your product is good, but they want to ensure they are getting a good value and aren’t willing to take many risks.
How to position and message about your product:
- Build out and leverage case studies of how other customers (bonus points if some are competitors for the late majority group) are winning by using your product.
- Consider discounts, additional incentives, and bundles to showcase the value of adopting your product.
Product features to focus on:
- Start to develop additional features that make your product more comprehensive for a wider variety of users.
- Implement ways for skeptical customers to experience value with no risk, such as free plans and free trials.

5. Laggards
The laggards may actively try and avoid using your product, so getting them on board may be a challenge. Often, they end up adopting due to outside forces. For example, their job may require it. If you’ve done a solid job adopting the earlier groups, you may be able to let time be your greatest ally.
How to position and message your product:
- Let everyone know that you are the market leader and those who aren’t using your product are the small minority.
- Focus on building partnerships that may reach the laggards through solutions and services they already subscribe to.
Product features to focus on:
- Be careful investing too much in targeting this group; you may be better off focusing on the next innovative solution for an additional product in your product suite.
- Focus on collecting data, such as NPS scores, to optimize your solution and to allow you to hyper-focus on in-app messaging and customization on individual customer segments.
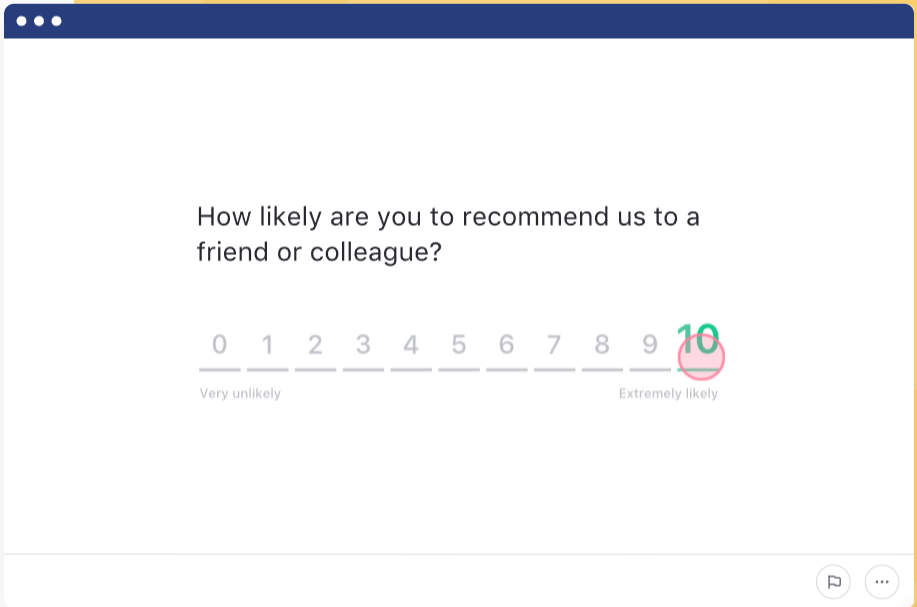
Stonly provides an easy, no-code solution to offer an NPS survey in your app within minutes. You can also set up custom post-survey paths to guide users to information and materials that may help them resolve their concerns or prompt them to share their love of your product as part of a third-party review.
Are you positioned to improve your adoption?
Now that you understand more about the product adoption curve and how to improve your product and its positioning to win at each stage, it’s time to put what you’ve learned to practice. But Rome wasn’t built in a day. Bookmark this guide and refer to it in the future for tips to help you adopt the next category of product adopters.
Stonly is a great partner to help you implement the software adoption best practices so that you can win at every stage. Its product onboarding tools help you guide users interactively to the best ways to solve their particular problems using your product. It can also help you with specific feature adoption, no-code NPS surveys, and customer behavioral tracking and insights to know where users are getting stuck and how to help.
Looking for easy-to-use product adoption software for your company?
Stonly helps make digital adoption hassle-free for your customers.
Start a FREE Trial
Frequently Asked Questions About the Product Adoption Curve
Which is the most important stage of the adoption curve?
While each stage of the product adoption curve is important and sequential, the two majority stages represent over two-thirds of your target market. Adopting these stages will dramatically increase your company’s growth.
What is the product adoption lifecycle?
There are many terms for the same concept in this guide. Product adoption lifecycle, technology adoption lifecycle, and innovation adoption lifecycle are all alternate and synonymous terms for the product adoption curve.
How do you use the product adoption curve for product marketing?
Understanding which group of adopters you are targeting helps you know how to best position your product and messaging to these users. See the “how to position and message about your product” lists in this guide for more ideas.